Working in the field & with the findings: the gang divides and conquers
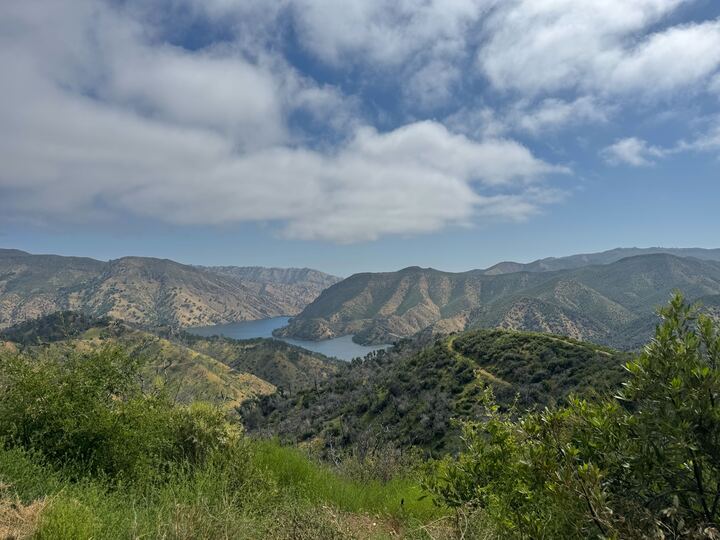
Today was a very productive day for our class in many aspects! Some people went out to Quail Ridge to finish up data collection, marking the official end to our time in the field! A bittersweet landmark.
The rest of the class spent the day in the classroom. Satellite group continued grinding, they are doing a great job! The remaining folk kicked off our adventure with in-house data collection. We got busy taking acorn measurements and obtaining bark density measurements. A couple people were brave enough to take on the beast of combing through our various data sheets and entering them into the master spreadsheet.
Minutes:
12:10pm - 12:20pm: Debrief and break up into groups: acorn analysis, bark density measurements, data entry, and satellite group
12:20 - 1:30 pm: Busy bees! Everybody worked in their respective groups to further our project along
1:30 - 1:40pm: Group Discussion; we went over what we accomplished and what there is left to do for the next class. We still need to enter some data that was collected today by our Quail Ridge team. Some people were nice enough to volunteer to enter that data before the next class period.
1:40 - 1:50: Satellite group debrief. They have been working very hard to obtain visualizations of various areas before and after the fire via satellite images. They also wrote up a detailed protocol in case anyone wants to incorporate this into their manuscript.
1:55 pm - 2:00 pm: final remarks and updates for next class!
FOR NEXT TIME:
We will start the session by finishing up the bark density and acorn measurements for data collected at Quail Ridge on Friday. This shouldn't take too long.
Wednesday is our long data analysis session. We will spend this time mainly working in R with the data we have collected. We worked hard in the first half of the quarter to familiarize ourselves with various data analysis methods in R, and now it’s time to put it to use!!
The beauty of this rich data set we have created is that each of us could turn in a completely unique paper! So during this class period, we will each be working on a more individual basis, with the help of Marshall and Crystal (and each other of course). Crystal will also be giving us a presentation on data analysis methods relevant to various types of data. We will then split up into groups based on research question similarity so that we are able to help each other out during the session.
In order to effectively analyze our data in such a short amount of time, we should come into the session with an idea of what trends we are looking to uncover.
To do before Wednesday:
Brainstorm 2-3 potential hypotheses or research questions that you are aiming to answer in your paper.
For each of these questions, think about which data parameters you will be analyzing and which specific R tools you can use in order to do this.
For example, if I am hypothesizing that woodpeckers will drill small holes in denser bark, I would want to analyze bark density and hole diameter for the same area on the same tree. Or if I want to investigate if woodpeckers will eat larger acorns first, I’d analyze hole diameter vs. hole occupancy.
Refer back to the R tutorials if needed:)
We are so close to closing out our project, we’ve got this!!! Finish strong!
"The goal is to turn data into information, and information into insight."
— Carly Fiorina


Comments
Post a Comment